Know All About Infographics For SEO In 30 Minutes!
Infographics are influential and have always been able to capture the attention of the readers. It reflects creativity at large and takes readers on an imagery journey. But it also becomes important to maintain infographics for SEO while creating your website.
And, once the brain is active in processing, half the purpose of writing the blog is achieved. Today, we are exposed to 5 times more information as compared to ‘80s. As our brain has to process more information, it is better to communicate through images for better retention. This is why the use of infographics has grown nearly 1000 percent since 2007.

65% of brands use infographics to strengthen their content marketing.
Let us read why infographics are important.
What are Infographics?
Infographics are visual ways of presenting information, data, or knowledge in a manner that makes complex ideas or data easy to understand. They use a mix of text, images, charts, graphs, and icons to communicate information attractively and straightforwardly.
The word “infographic” is a blend of “information” and “graphic,” and these visual tools have gained significant popularity due to their effectiveness in communicating information in the digital age.
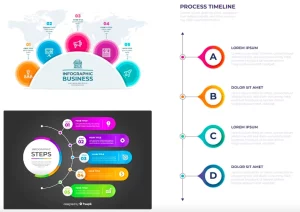
Infographics come in various styles and layouts, such as timelines, flowcharts, comparison charts, and statistical representations. Designers carefully choose colours, fonts, and icons to align with the topic and target audience.
In the digital era, where information overload is common, infographics have become a valuable tool for businesses, educators, journalists, and marketers to convey information effectively and leave a lasting impression on their audience.
Stats on infographics
- According to HubSpot, blog articles enriched with infographics experience a remarkable 178% increase in inbound links.
- According to Single Grain, 65% of brands incorporate infographics into their content marketing strategy.
- Venngage’s data reveals that infographics are the second most utilised visual content, making up 36.6% of the visuals used.
- Forbes reports that 84% of marketers, who have utilised infographics in the past, attest to their effectiveness.
- Infographics hold an impressive advantage over complete articles, as Venngage indicates they are 30 times more likely to be read.
- Publishers that integrate infographics into their content generate 12% more traffic than those that do not, as observed by Unbounce.
- The power of infographics on social media is evident, with MarketingProfs reporting that people are three times more likely to like and share infographics than other types of content.
- A compelling statistic by Jeff Bullas states that 45% of online visitors are enticed to click on links that feature infographics.
- Information when paired with a relevant image, people retain 65% of it.
- The use of colour in infographics increases readership by approximately 80%.
Read: Why is Content important?
Why are Infographics Important for SEO & Marketing?
These are the reasons why infographics are important for marketing:
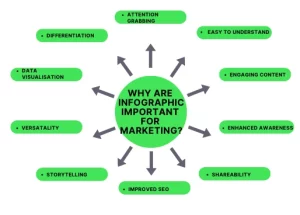
Attention-Grabbing
Infographics are visually appealing and eye-catching, making them more likely to capture the audience’s attention amid online content.
Easy to Understand
They simplify complex information using visuals and concise text, making it easier for your audience to grasp and remember key points.
Engaging Content
Infographics keep your audience engaged with compelling visuals, leading to higher interaction rates and increased time spent on your content.
Enhanced Brand Awareness
Creating branded infographics helps reinforce your brand identity and increases brand awareness among your target audience.
Infographics are highly shareable on social media platforms, increasing your content’s reach and potential for virality.
Improved SEO
They attract backlinks from other websites, boosting your search engine rankings and driving organic traffic to your website.
Storytelling
Infographics enable you to tell a story with data, making your marketing messages more memorable and impactful.
Versatility
You can use infographics across various marketing channels, such as websites, social media, email campaigns, and presentations.
Data Visualisation
Infographics are excellent for presenting statistics and research findings in a visually compelling and understandable way.
Differentiation
Using infographics sets you apart from competitors, showcasing your creativity and dedication to providing valuable content.
Tips to Create Amazing Infographics for Blogs
Creating unique infographics for blogs can significantly enhance your content and engage your audience. Here are some tips to help you craft compelling infographics:
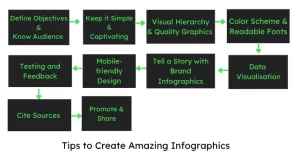
Define Your Objective
Clearly outline the purpose of your infographic. Identify the main message or data you want to convey to your readers.
Know your Audience
Understand your target audience and what information would resonate with them. Tailor your infographic’s design and content to their preferences.
Keep it Simple
Avoid cluttering the infographic with excessive information. Stick to the key points and use concise text to convey your message effectively.
Choosing a Captivating Topic
Select a topic that is relevant, interesting, and likely to appeal to your readers. Unique and trending subjects can attract more attention.
Visual Hierarchy
Organise the information in a clear visual hierarchy. Use headings, subheadings, and different font sizes to guide readers through the content.
Use High-Quality Graphics
High-quality images, icons, and illustrations to ensure a professional and polished look.
Color Scheme
Choose a harmonious color palette that aligns with your brand and evokes the right emotions. Avoid using too many colors to maintain visual coherence.
Readable Fonts
Use easy-to-read fonts for both headings and body text. Stay consistent with font styles to maintain a cohesive design.
Data Visualisation
Present data using charts, graphs, and icons. Visualise complex information to make it more accessible and understandable.
Tell a Story
Create a narrative flow within the infographic to guide readers from start to finish. Use a compelling introduction and a clear conclusion.
Brand your Infographic
Incorporate your logo and colours to increase brand recognition and tie the infographic back to your brand identity.
Mobile Friendly Design
Ensure your infographic is responsive and can be viewed on various devices, including smartphones and tablets.
Testing and Feedback
Seek feedback from colleagues or target audience members to refine your infographic before publishing.
Cite Sources
If you include statistics or data from external sources, provide proper citations to maintain credibility.
Once your infographic is ready, promote it across your blog, social media platforms, and email newsletters to reach a broader audience.
Example of Infographics
Let us see an example of an infographic Nike.

In this example, Nike, a renowned sportswear brand, creates an infographic showcasing the evolution of their iconic sneakers over the years. The infographic highlights the brand’s innovation, design progression, and cultural impact through footwear.
Key Elements of the Infographic
These are the key elements of an infographic
Visual Timeline
The infographic begins with a visually appealing timeline that spans several decades, capturing the key milestones of Nike’s sneaker development.
Iconic Sneakers Images
For each significant period, the infographic features images of the most iconic sneakers released by Nike during that time, such as the Air Jordan 1, Air Max 1, and Nike Dunk.
Brief Description
Alongside each sneaker image, short and engaging descriptions outline the unique features, design elements, and performance advancements of each shoe.
Data Visualisation
The infographic incorporates data visualisations, such as bar charts or pie charts, to showcase statistics related to sneaker sales, customer satisfaction, or athlete endorsements.
Color Palette
Nike’s signature brand colours, like black, white, and the iconic “Nike Swoosh” logo’s vibrant orange, are consistently used throughout the design.
Font Style
The typography used is modern, sleek, and representative of the brand’s contemporary identity, maintaining a sense of professionalism and brand consistency.
Call-to-Action
The infographic concludes with a compelling call-to-action encouraging readers to explore Nike’s latest sneaker collection or visit their website for more information.
Purpose and Impact:
This infographic serves as a powerful marketing tool for Nike. It showcases the brand’s rich history, innovation, and product excellence while reinforcing its position as a leader in the sportswear industry. By sharing this infographic on their website, social media channels, and marketing campaigns, Nike attracts sneaker enthusiasts, sports fans, and potential customers, fostering brand loyalty and generating interest in their latest sneaker releases.
Conclusion
Infographics are a dynamic and indispensable asset in the ever-evolving marketing and content creation world. As we’ve explored throughout this blog, these visually engaging tools have the remarkable ability to capture attention, simplify complex information, and leave a lasting impact on audiences.
With their eye-catching designs, infographics act as a magnet, drawing readers into the heart of your message. Whether it’s presenting data, sharing insights, or narrating a compelling story, infographics transform mundane information into captivating visual journeys that resonate with people across various demographics. Noboru World can help you design dynamic infographics. Contact us at hello[at]noboruworld.com
FAQ
What is an infographic?
An infographic visualises information, data, or knowledge that combines text, images, charts, graphs, and icons to convey complex concepts or data clearly and engagingly.
Why are infographics important?
Infographics are essential for marketing and communication because they grab attention, simplify complex information, engage audiences, and enhance brand visibility. They are highly shareable on social media and can improve information retention among readers.
How do infographics benefit marketing efforts?
Infographics boost marketing efforts by making information more attractive, accessible, and memorable. They increase brand awareness, generate website traffic, improve SEO, and foster engagement with target audiences.
What makes a successful infographic?
A successful infographic is visually appealing, has a clear objective, targets the right audience, presents information in a simple and organised manner, and tells a compelling story. It should also align with brand identity and maintain consistency in design elements.
Can anyone create an infographic?
Indeed, thanks to accessible data visualization tools and design software, anyone can craft infographics. Yet, for them to be top-notch and impactful, it’s vital to grasp fundamental design principles and data representation.
What data can be included in an infographic?
Infographics can include various data types, such as statistics, survey results, market trends, comparisons, timelines, and process flows. The key is to choose relevant and compelling data that supports the infographic’s purpose.
How do infographics enhance content engagement?
Infographics captivate audiences by displaying information in a visually attractive and easily digestible style. Blending images with text grabs people’s interest, piques their curiosity, and motivates them to delve deeper into the content.
Are there any best practices for creating infographics?
To make effective infographics, it’s advisable to follow some fundamental guidelines. These include maintaining a clean and straightforward design, incorporating top-notch graphics and visuals, choosing a suitable colour scheme, and guaranteeing the content is precise and thoroughly researched.
Can infographics be used for educational purposes?
Infographics serve as valuable educational aids by breaking down intricate ideas, rendering them more accessible for students and learners to grasp. They find applications in educational institutions, including schools, colleges, online courses, and educational websites.
How can I promote my infographic?
Enhance the visibility of your infographic by posting it on your website, blog, and social media channels. Explore opportunities for collaboration or guest posts with influencers, industry blogs, and pertinent websites. Think about using email newsletters to distribute the infographic to your subscribers.


