Data Analytics
What Is Data Analytics
Data analytics is a set of tools and methods to go through the pile of raw data and help you organize it and find interesting patterns or hidden information. These tools and methods can be automated, making them work faster and easier for you to understand the information.
Many companies collect massive amounts of data, but it remains a jumbled mess without analysis. This is where data analytics steps in – the magic that transforms this raw data into actionable insights.
—————————————————————————————-
Role Of Data Analyst
Think of a data analyst as a translator. The Data Analyst role includes taking incomprehensible numbers, organizing them, and uncovering hidden patterns. These patterns translate into clear, actionable information that fuels smart business decisions.
—————————————————————————————-
Imagine data analytics as a form of business intelligence, a detective agency within your company. It solves puzzles hidden within your data – how your customers behave, how employees use specific tools, and more. Data analytics empowers you to ditch gut feelings and make informed decisions based on real information by analyzing past trends and predicting future behavior.
In short, data analytics helps you navigate the sea of data and surface with valuable insights, propelling your business forward.
Types Of Data Analytics
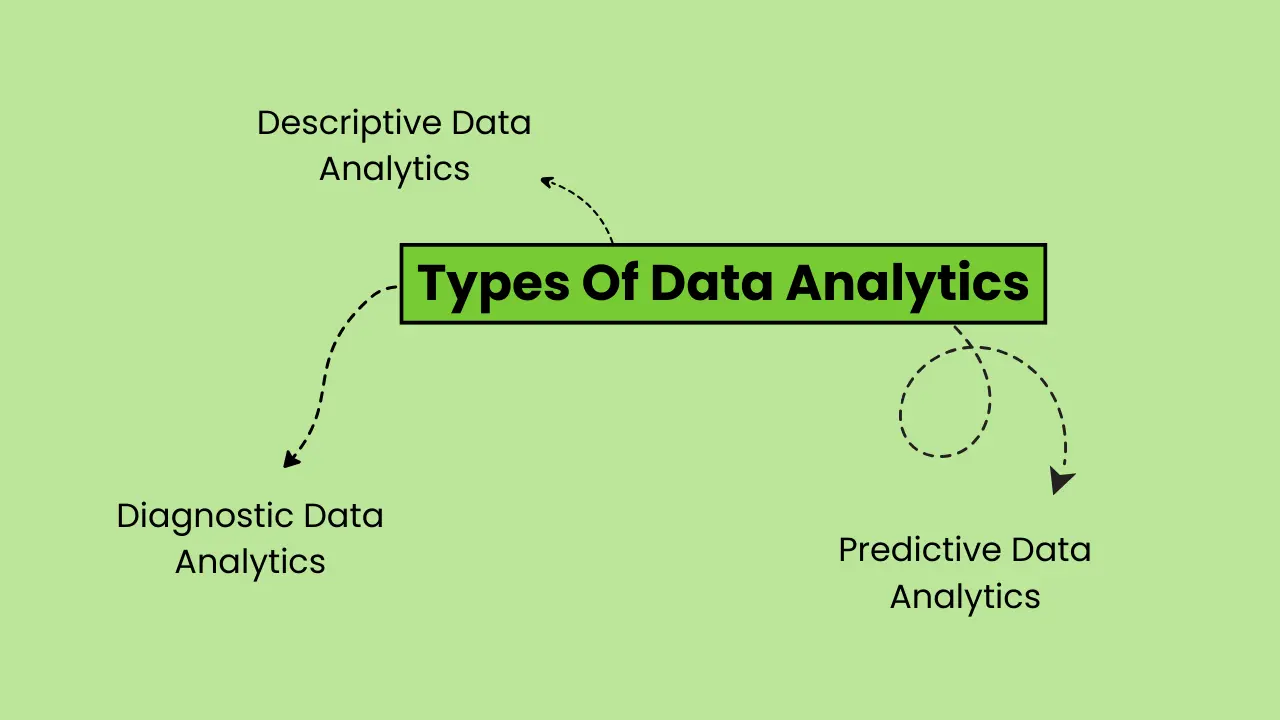 Data analytics encompasses a broad range of techniques to extract insights from data. Here are three additional types of data analytics, explained using the requested structure:
Descriptive Data Analytics
What is it: Descriptive analytics focuses on summarizing and describing the basic characteristics of data. It provides a clear picture of what has happened in the past.
Key Points:
- Summarizes data using measures like central tendency (average, median) and dispersion (range, standard deviation).
- Often uses basic visualizations like bar charts, pie charts, and line graphs.
- Helps understand past performance and identify trends.
Example: A retail store might use descriptive analytics to see which products sold the most in a specific month, providing insights into customer preferences.
Diagnostic Data Analytics
What is it: Diagnostic analytics delves deeper to answer “why” something happened. It helps identify the root causes of trends or patterns observed in descriptive analytics.
Key Points:
- Uses techniques like data mining and drill-down analysis to explore specific data points.
- Identifies correlations and relationships between different data variables.
- Helps diagnose issues and understand the factors influencing certain outcomes.
Example: A website might use diagnostic analytics to see which pages have high bounce rates (users leaving quickly) and investigate why those pages are underperforming.
Predictive Data Analytics
What is it: Predictive analytics uses historical data and statistical models to forecast future trends and behaviors.
Key Points:
- Leverages techniques like machine learning and regression analysis to build predictive models.
- Helps anticipate future outcomes and make informed decisions based on those predictions.
- Used for tasks like customer churn prediction, targeted marketing campaigns, and demand forecasting.
Example: A streaming service might use predictive analytics to recommend content to users based on their past viewing history, aiming to personalize the user experience and increase engagement.
How Businesses Use Data Analytics
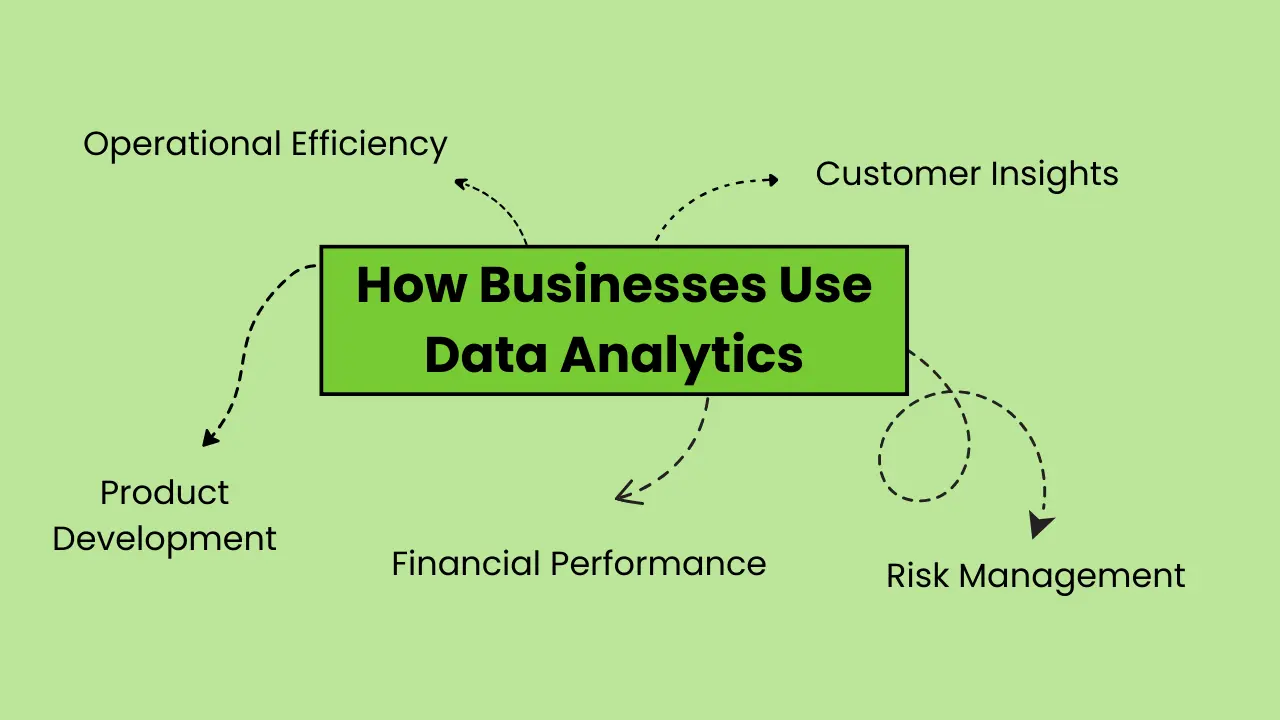
Data analytics is a game-changer for businesses, since it allows them to transform their raw data into actionable insights that help them drive informed decision-making.
Customer Insights: Businesses use data analytics to understand their customers better. It could be by analyzing purchase history, demographics, and website behavior, or by identifying customer preferences, predicting future needs, and personalizing marketing campaigns for better engagement.
Operational Efficiency: Data analytics helps businesses by identifying inefficiencies in their operations. With this they can analyze data from various sources like production lines, inventory management systems, and customer service interactions to pinpoint bottlenecks, optimize processes, and reduce costs.
Product Development: It plays a crucial role in product development. With the help of it, businesses can analyze customer feedback, usage data, and could do competitor analysis to identify market trends, understand customer needs, and develop products that resonate with their target audience.
Financial Performance: It empowers businesses to track and analyze financial
Performance since it is very important for any business or startup owner. By analyzing sales data, marketing spend, and customer acquisition costs, companies can identify areas for improvement, optimize pricing strategies, and make informed investment decisions.
Risk Management: It helps businesses assess and mitigate risks. Analyzing historical data on fraud, customer churn, and market fluctuations allows companies to develop proactive strategies to minimize potential risks and ensure business continuity.
Steps for Using Data Analytics
Imagine a new startup selling handmade organic soaps online. Here’s how they can leverage data analytics:
Define Goals and Objectives:
What do they want to achieve with data analytics? Increase sales? Understand customer preferences?
Identify Data Sources:
Sales data, website traffic data, customer reviews, and social media engagement are potential sources.
Collect and Organize Data:
Integrate data collection tools with their website and sales platform.
Choose the Right Tools:
Start with simple analytics tools that offer user-friendly dashboards and reporting features. We will further discuss in this article about different useful tools for data analytics.
Analyze the Data:
Look for trends in customer demographics, popular product categories, and website behavior.
Actionable Insights:
Based on the analysis, develop targeted marketing campaigns for specific customer segments, refine product offerings based on demand, and optimize website navigation for better user experience.
Refine and Iterate:
Data analytics is an ongoing process. Regularly analyze data, adjust strategies based on new insights, and continue to optimize operations for long-term success.
By following these steps, the startup or any business can harness the power of data analytics to gain a competitive edge, make data-driven decisions, and achieve their business goals. As they grow and collect more data, they can explore more advanced analytics techniques to further refine their strategies and reach new heights.
Tools For Data Analytics
1. Data Visualization Tool: Tableau
Definition: Tableau is a powerful and user-friendly data visualization platform that lets you create interactive dashboards and reports. It excels at converting complex data sets into understandable and visually appealing insights.
Features:
- Drag-and-drop interface for easy data exploration and visualization creation.
- Wide variety of chart types and customization options.
- Ability to connect to various data sources (databases, spreadsheets, cloud storage).
- Real-time data visualization for monitoring trends as they occur.
- Collaboration features for sharing and discussing insights with others.
Pricing: Tableau offers a free trial and several paid plans. Pricing varies depending on deployment options (cloud-based or on-premise) and the number of users. It typically ranges from $12/user/month for the Tableau Viewer plan to $70/user/month for Tableau Server, which caters to larger teams and enterprise needs.
2. Data Analysis & Programming Tool: Python
Definition: Python is a high-level, general-purpose programming language that is extensively used in data analytics. It is well-known for its readability, large ecosystem of data science libraries, and extensive functionality.
Features:
- Extensive libraries like pandas (data manipulation), NumPy (numerical computing), Matplotlib (data visualization), and scikit-learn (machine learning) that provide powerful data analysis capabilities.
- Open-source and free to use, making it accessible to a large user base.
- Large and active community for support and learning resources.
Pricing: Since Python is open-source, there’s no direct cost associated with using the language itself. However, some cloud-based Python development environments or specific libraries might have associated fees.
3. Data Management & Business Intelligence Tool: Microsoft Power BI
Definition: Microsoft Power BI is a set of business intelligence (BI) tools that includes features for data warehousing, analysis, and visualization. It works seamlessly with other Microsoft products and provides a complete solution for organizations that have already invested in the Microsoft ecosystem.
Features:
- Self-service data preparation and exploration tools for both technical and non-technical users.
- Pre-built connectors for various data sources (databases, cloud storage, web services).
- Interactive dashboards and reports with drill-down capabilities for deeper analysis.
- Integration with Microsoft Office products (Excel, Teams) for easy data sharing and collaboration.
Pricing: Power BI offers a free desktop version with limited features. Paid plans start at $10/user/month for Power BI Pro, which provides cloud-based access and collaboration features. Enterprise-level pricing is available upon request.
Best tool for your needs depends on your specific requirements, technical expertise, and budget. It’s important to consider the type of data you’ll be working with, the desired level of visualization, and the analytical capabilities needed when choosing a data analytics tool.
Techniques For Data Analytics
Data analytics is not just about collecting data. It’s also about transforming raw information into actionable insights that drive informed decisions. Here are some key techniques used in data analytics:
Descriptive Techniques:
- Central Tendency: This contains measures like mean, median, and mode summarizing a dataset, providing a basic understanding of its average or central value.
- Dispersion: Metrics like variance and standard deviation show how spread out the data points are around the central tendency.
- Frequency Distribution: It includes analysis of how often specific values appear in the data helps identify patterns and potential outliers.
- Visualization: Techniques like bar charts, pie charts, and line graphs visually represent the data, making it easier to understand trends and relationships.
Diagnostic Techniques:
- Data Mining: This involves exploring large datasets to know hidden patterns, trends, and relationships that might not be readily apparent with basic analysis.
- Drill-Down Analysis: Process for this includes – Starting with a broad overview and then progressively digging deeper into specific data points to understand the underlying causes of trends or patterns.
- Cohort Analysis: Segmenting data based on shared characteristics (e.g., customer acquisition date) and comparing them to identify differences and understand how groups behave over time.
Predictive Techniques:
- Regression Analysis: This technique identifies the relationship between a dependent variable (what you want to predict) and one or more independent variables (factors influencing the dependent variable). It allows you to build models to help you forecast future values based on historical data.
- Machine Learning: Algorithms are trained on historical data to learn patterns and predict future events. Techniques like decision trees, random forests, and support vector machines are used for various predictive tasks.
- Time Series Analysis: This technique analysis data collected over time to forecast future trends and patterns. It helps in predicting sales, website traffic, or stock prices.
Importance of Data Analytics
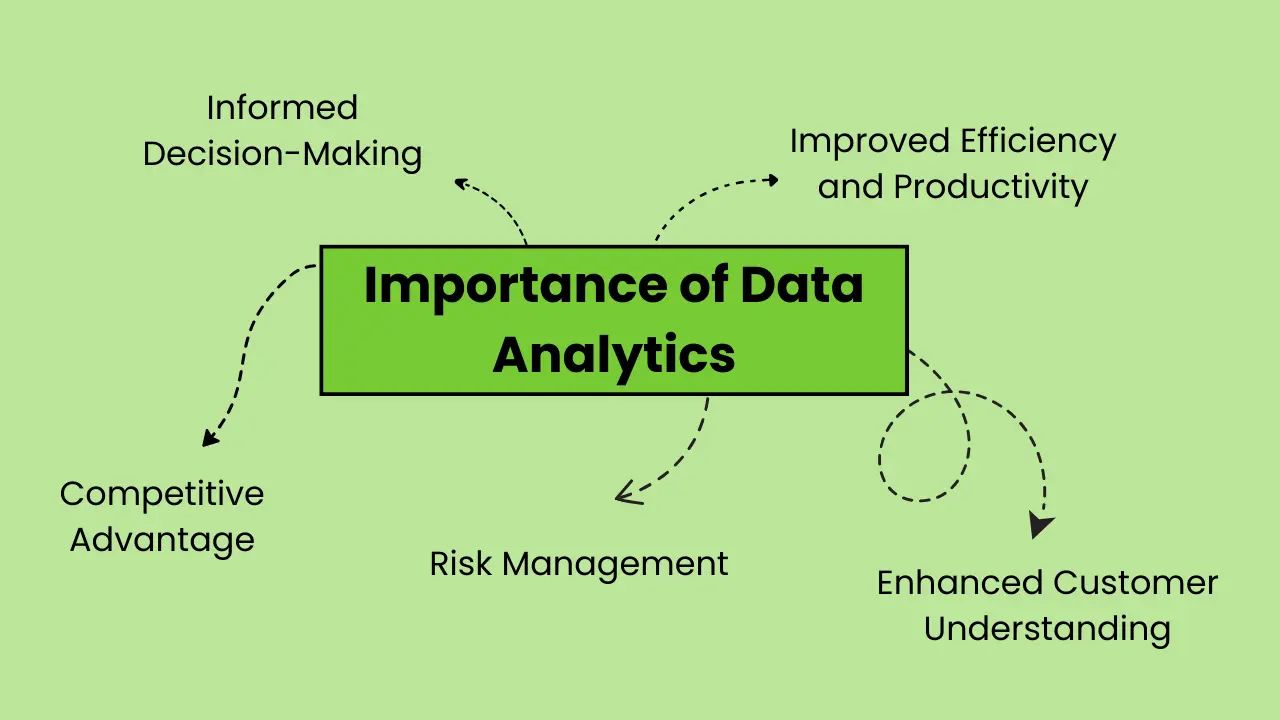
In today’s world, it has become quite essential for businesses to use data analytics if they want to have a detailed overview about their business.
Informed Decision-Making:
Data analytics enables businesses to move past intuition and guesswork. Analyzing data allows businesses to gain a better understanding of their customers, operations, and market trends. This data-driven approach leads to better-informed and more successful decisions.
Improved Efficiency and Productivity:
Data analytics can help identify process and workflow improvement opportunities. Businesses can identify bottlenecks and inefficiencies by analyzing data from production lines, customer service interactions, and marketing campaigns. This enables them to streamline operations, optimize resource allocation, and, ultimately, increase productivity.
Enhanced Customer Understanding:
In today’s data-driven world, understanding your customers is critical to success. Data analytics enables businesses to analyze customer behavior, preferences, and purchasing patterns. This knowledge enables businesses to personalize marketing campaigns, create targeted products and services, and increase customer satisfaction and loyalty.
Competitive Advantage:
Businesses that effectively use it have gained a significant advantage over their competitors. They can identify market trends faster, adapt to changing customer needs more quickly, and optimize their strategies for greater performance. Data analytics enables businesses to stay ahead of the competition and disrupt entire industries.
Risk Management:
It enables businesses to identify and manage potential risks. Companies can develop proactive strategies to mitigate risks and ensure business continuity by analyzing historical data on fraud, customer churn, and market fluctuations.
Innovation and Growth:
It is critical to driving innovation. Businesses can use customer feedback, usage data, and competitor analysis to identify new market opportunities and create innovative products and services that appeal to their target audience. This data-driven approach promotes continuous improvement and helps businesses grow.
Improved Communication:
Data analysis uses clear and compelling visuals, such as charts and graphs, to present complex information in an understandable format. This improves communication between departments and stakeholders, encourages collaboration, and ensures everyone is on the same page when making decisions.
Data analytics is no longer a luxury; it’s a necessity for businesses of all sizes. By leveraging this powerful tool and its techniques, companies can gain valuable insights from their data, make informed decisions, optimize operations, and achieve their strategic goals.
The Story of Spotify’s Data-Driven Playlist Revolution

Source: Spotify
Challenge:
Spotify, the world’s leading music streaming platform, faced a challenge in keeping users interested. With millions of songs and countless artists, users frequently struggled to find new music they enjoyed or felt overwhelmed by the selection. This could cause user churn (subscription cancellations).
Solution:
Spotify adopted data analytics to personalize the user experience. They implemented a few key strategies:
- Collaborative Filtering: This technique analyzes similar users’ listening habits to recommend music that others with similar tastes have enjoyed.
- Content-Based Filtering: Spotify recommends similar songs based on audio features such as tempo, genre, and artist.
- Algorithmic Playlists: Curated playlists such as “Discover Weekly” and “Release Radar” use collaborative and content-based filtering to provide users with a personalized selection of new songs and releases that they will likely enjoy.
- Daily Mixes and Personalized Radio Stations: These features use user listening data and preferences to generate dynamic playlists and radio stations that change over time in response to user interaction.
Key Takeaways:
- Personalization is Essential: Using data analytics to personalize music recommendations, Spotify keeps users engaged and reduces churn.
- Data Drives Innovation: By analyzing data, Spotify created innovative features like “Discover Weekly” that have transformed music discovery.
- Embrace New Technologies: Spotify’s investment in data science and machine learning has been critical to its growth.
- Focus on User Experience: In the end, data analytics improves the user experience and keeps users returning for more.
Beyond Music:
Spotify’s success story demonstrates the value of data analytics across industries. It shows how data can be used for:
- Understanding customer behavior: By analyzing user data, businesses can gain valuable insights into how customers interact with their products and services.
- Create targeted marketing campaigns: Data enables businesses to reach the right people with the right message at the right time.
- Optimize products and services: Data analysis can help identify areas for improvement and ensure that products and services meet customer needs.
Conclusion
Data analytics helps us make sense of all that data, not just for businesses, but for anyone. It’s like having a magic tool that turns piles of numbers into clear and helpful information. This information can then be used to make better decisions, both big and small.


We would love to have your opinion.