Core Web Vitals: Ready Guide for 2023

Introduction
Core Web Vitals are a set of specific factors that Google values to measure the overall user experience on a webpage. The three vitals measure page speed and user interaction to confirm why a page is visited often or left immediately. The three vitals are the largest contentful paint, first input delay, and cumulative layout shift.
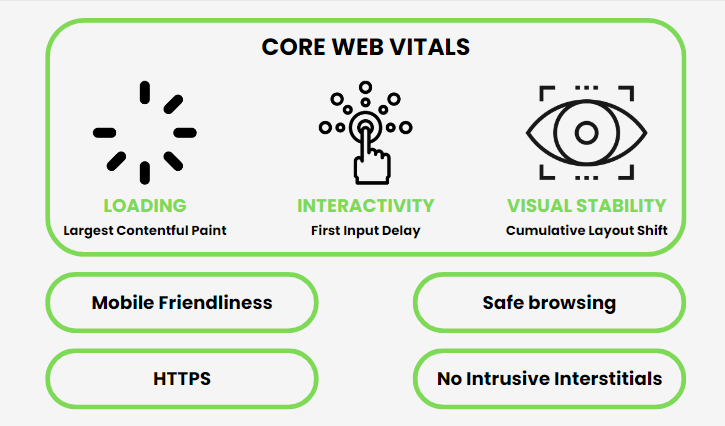
The website’s performance is also measured for mobile friendliness, safe browsing, HTTPS, and no intrusive interstitials. These factors influence a website’s performance dynamics which affect the site’s ranking.
Core Web Vitals were introduced in May 2020 and since then it has got mandatory for website owners to work on improving the web vitals if they dream to rank higher on SERP.
Let us read in detail the three core web vitals and why they are important.
What are Core Web Vitals?
Think that if you want to search for the nearest five-star hotel near me, you search on Google. Now, the first page will look for looks like this:

It is highly probable that you will click on the first link “Ramada by Wyndham Jaipur”. And if after clicking on the link, if it takes a longer time to load, you will most likely exit the page and move on to the next option.
Here comes the relevance of core web vitals. Because Ramada is shown on top, it is suited that the website of Ramada qualifies for the specific measurements that evaluate the performance of the page.
Let us now look at each core web vital one by one:
Largest Contentful Paint:
The largest contentful paint became a ranking factor to measure the website’s performance. It measures how long the home page takes to download and allows users to interact with it. LCP measures the largest image or block of context that takes time to load. The elements that load beyond the screen are not counted.
The elements that are measured to find LCP are:
- Video poster images
- Images
- Background images
- Block-level text elements
The elements decide how much time it takes content to load on screen after clicking on any of these.
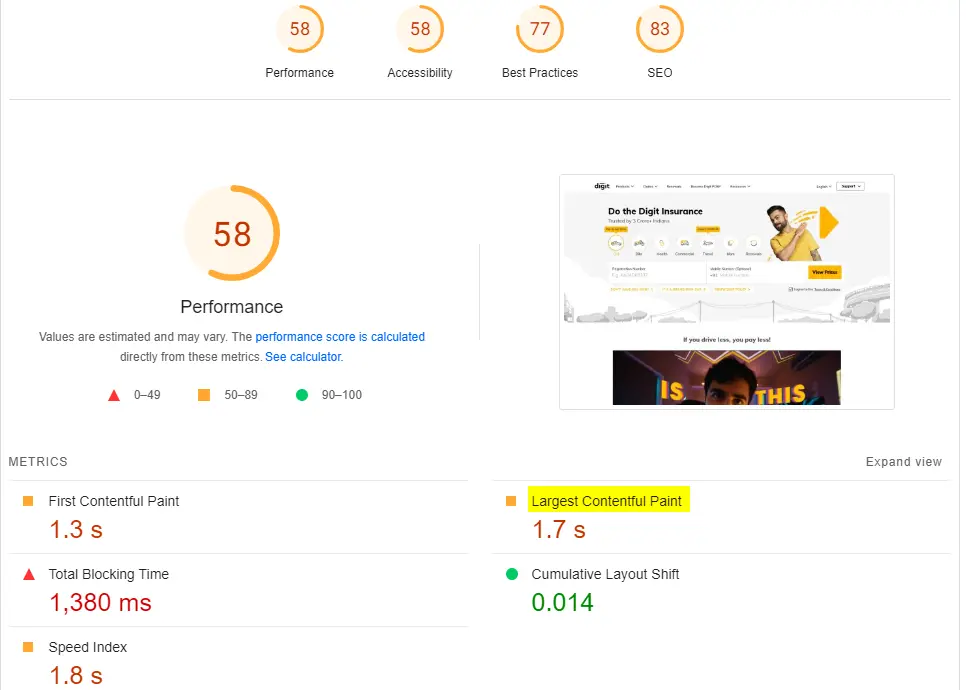
You can measure the largest contentful paint using Google PageSpeed Insights. Here is the screenshot for LCP measured for https://www.godigit.com/
Speaking of how much Google wants the LCP to be. The picture below explains whether you have to take the necessary actions or not:
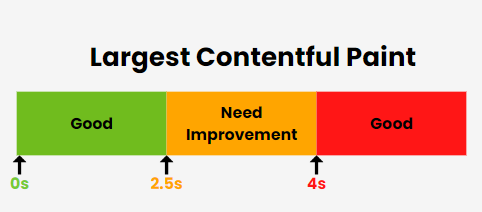
It shows that for a website, the ideal LCP for a site is 2.5 seconds or less. But it is challenging for several companies to do that, especially for each page. In another example, we can see

Backlinko by Brian Dean is the most recommended site if people want to read about SEO. Still, the site does not have an LCP of less than 2.5 seconds.
It is important to work on the LCP and here is how you can improve LCP:
- Upgrade web host because better hosting means faster load times.
- Remove unnecessary third-party scripts because it can slow each page speed by 34 ms.
- Choose lazy loading in which images load on the pages only when someone scrolls the page. It saves time and the site loads faster.
- Remove large page elements which can be found in the Google PageSpeed Insights reports.
- Minifying CSS can delay LCP times.
First Input Delay
First Input Delay measures the time taken for a user to interact with the page after it is loaded. Some of the ways you can interact with the page include:
- Choose an option from the menu.
- Leaving email id information on the page.
- Click on the site’s navigation.
- Opening Accordion style content.
Just like LCP, Google has defined limits for FID also.
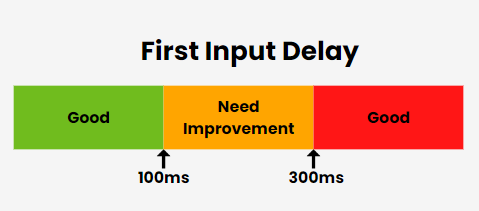
The screenshot shows that FID of 100ms or less is suitable. Pages taking more than this turn the performance of the website low affecting the ranking and taking it down.
For Digit Insurance, the FID as measured in Google PageSpeed Insights shows:
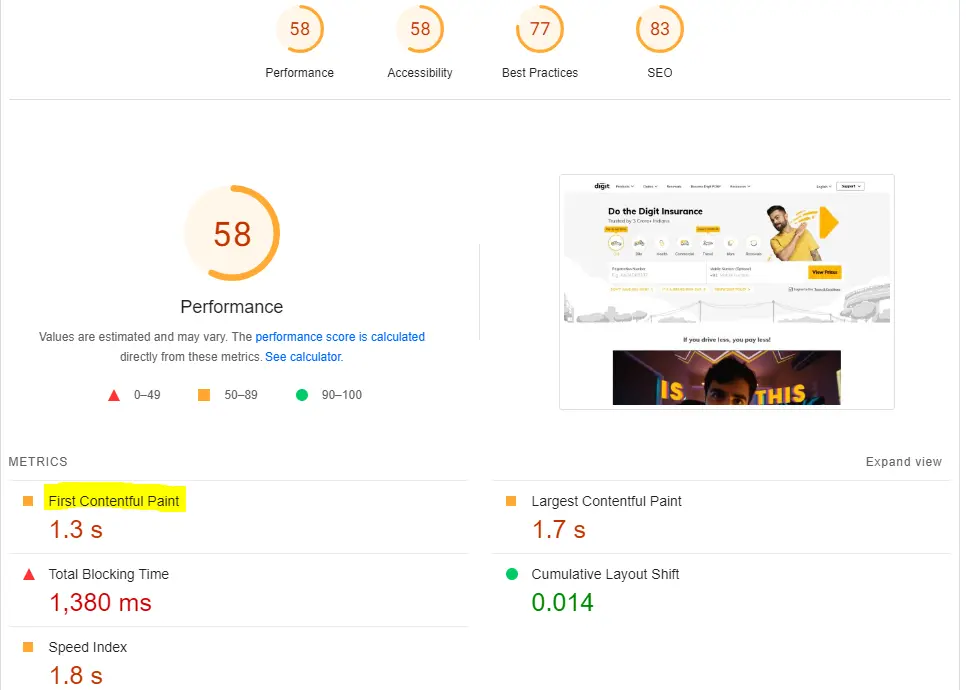
For Digit Insurance, it shows that FID is 34ms which is good.
Here are a few things one can do to improve the First Input Delay score and further push the ranking of their website higher:
- Remove non-critical third-party scripts like Google Analytics which can slow the speed of the page and hence interaction.
- Use browser cache as it helps to load the page faster through JS loading task even faster.
- Minimize JavaScript as it gets challenging for people to interact with your page when the browser is loading.
Cumulative Layout Shift
The cumulative Layout Shift explains the visual stability of the page. It shows how stable a page is when it loads. At times, the elements on the page move when the site starts loading which impacts the CLS.
It is important for a site to be stable because then the visitors will have to re-look into where the links are and where they should click. The guidelines from Google say that CLS should be :
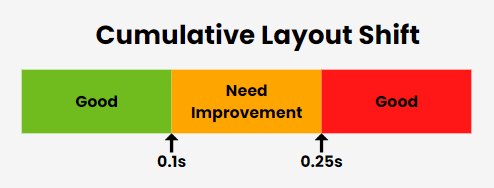
The image shows that CLS should be less than 0.1 seconds. More than this, it takes a lot of time for the elements to get stable.
CLS as measured for Digit Insurance is:
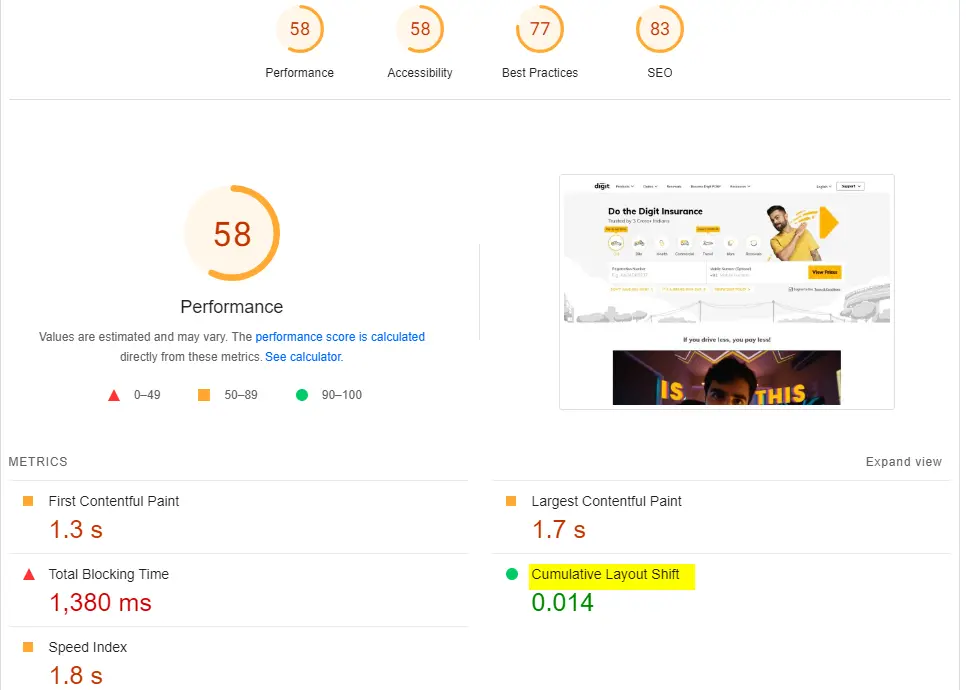
The CLS for the web page is 0.01second which is great.
Those looking at the ways in which you can reduce the CLS and bring it to an acceptable level.
- Make sure that the ads are posted at a specific place. If you fail to monitor this, ads can pop up anywhere on the homepage ultimately stealing the value of the content.
- Use images of set attributes: The browser knows how much space an image element should take. It is advisable to stick to the prescribed dimensions of videos, images, infographics, and GIFs to prevent the CLS to increase.
- Keep the content where it is expected to be. Changing the place of the content can affect the CLS score poorly.
- Add new user interface elements between the fold as it will not push the content down and it stays where it was loaded.
- Use web fonts that make your page look pretty. System fonts help a web page load quickly.
After reading the Core web Vital metrics in detail, let us summarise the importance of Core Web Vitals.
Why are Core Web Vitals Important?
These are the reasons why Core Web Vitals are important:
- Major Ranking Factor:
Google has included Core Web Vital as the major ranking factor. The website that qualifies the metrics are ranked higher.
- Page experience:
In the recent algorithm by Google, page experience is a vital factor that will be important for higher ranking in SERP. This made working on Core Web Vitals and removing the page issues, if any.
- Influences user-experience:
The higher the Core Web Vitals score better will be the user experience. If on interacting with the page, the elements load faster and they do not move, there are higher chances that the visitor will stay on the page. The lower bounce rates indicate an improved user experience which is another factor considered by Google to rank the website higher.
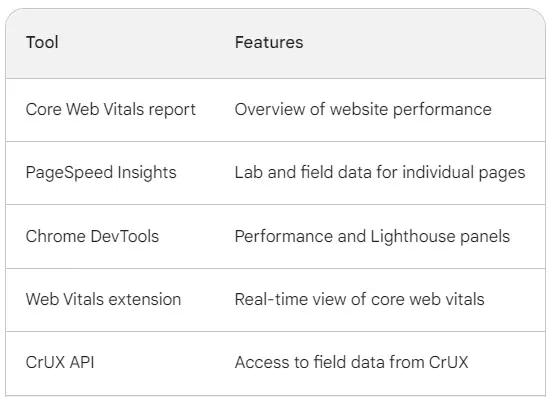
How to measure Core Web Vitals?
Measuring a metric is correct when you deploy these tools. These are the ways in which you can measure the core web vitals.
- Google PageSpeed Insights:
Google PageSpeed Insights provide you information on the user experience of the page on both devices that includes mobile and website. The metric provides in-depth field and lab data about the page. PSI reports generate outputs like Largest Contentful Paint (LCP), First Contentful Paint (FCP), First Input Delay (FID), and Cumulative Layout Shift (CLS). It also gives reports on Interaction to the Next Paint(INP) and Time to First Byte (TTFB).
These are the threshold values that you must consider and work out to improve page performance.
Source:www.developers.google.com
The reports from Google PageSpeed Insights are pretty reliable and give accurate readings about user experience. A good PageSpeed Insight score should be 90 or above.
| PageSpeed Insight Score | Report |
| 90 or above | Good |
| 50-90 | Needs Improvement |
| Below 50 | Poor |
To use Google PageSpeed Insights, you can do this:
Step 1: Visit Google PageSpeed Insights Page.
Step 2: Enter the URL of your website.
Step 3: Hit on “Analyse”
Step 4: You see a detailed report but all of the information is not of use.
Step5:Click on “Opportunity” as it gives tangible information. For example, we looked for information about Digit Insurance. This is what the Opportunity section looks like.
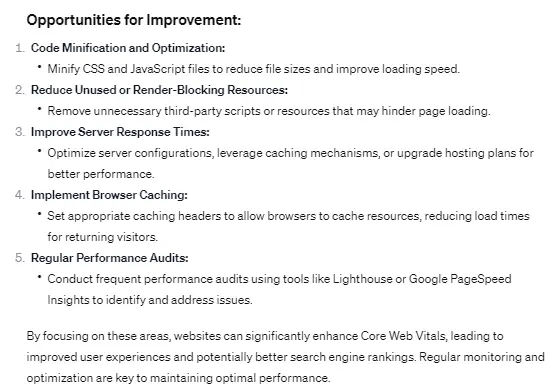
The section gives an indication of what should be improved to correct the Page Speed.
- Google Search Console
Another tool from Google that helps you measure the site’s traffic and performance further enabling you to fix issues is the Search Console. Initially, up until 2015, the tool was called Google Webmaster Tool.
Source: www.search.google.com
You can use the tool to troubleshoot, monitor, and maintain the site’s presence in Google Search Results. To use the tool you can follow these steps:
Step 1: Login to search.google.com/search-console
Step 2: Click the blue “Start Now” to sign in to your Gmail account.
Step 3: Verify that you have logged in using the right Gmail account which is linked to your website. You can also enter the website domain and verify it. There are three ways in which you can verify the website that includes HTML Tag, HTML File, Google Tag Manager, and Google Analytics.
Let us see how you can verify the website for your account:
HTML File
Upload an HTML file to the root folder either via FTP or a cPanel File Manager. Take the help of your website developer if you are not confident to verify the file.

Download the file provided by Google and access the root directory of your site. Upload the file and return it to Google Search Console to verify.
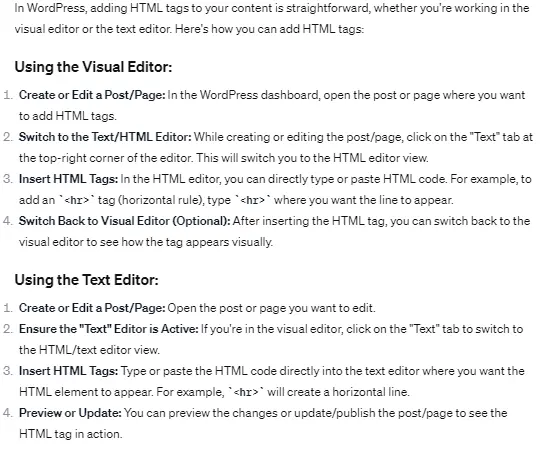
HTML Tag:
To verify using an HTML tag you need to add a meta tag to the <head> section of your site. You will have to take help from your developer to do so.
If you have a website on WordPress, this is how you do it:
 Google Analytics
It applies to those who have a Google Analytics account. Follow these steps and click on “Verify”.
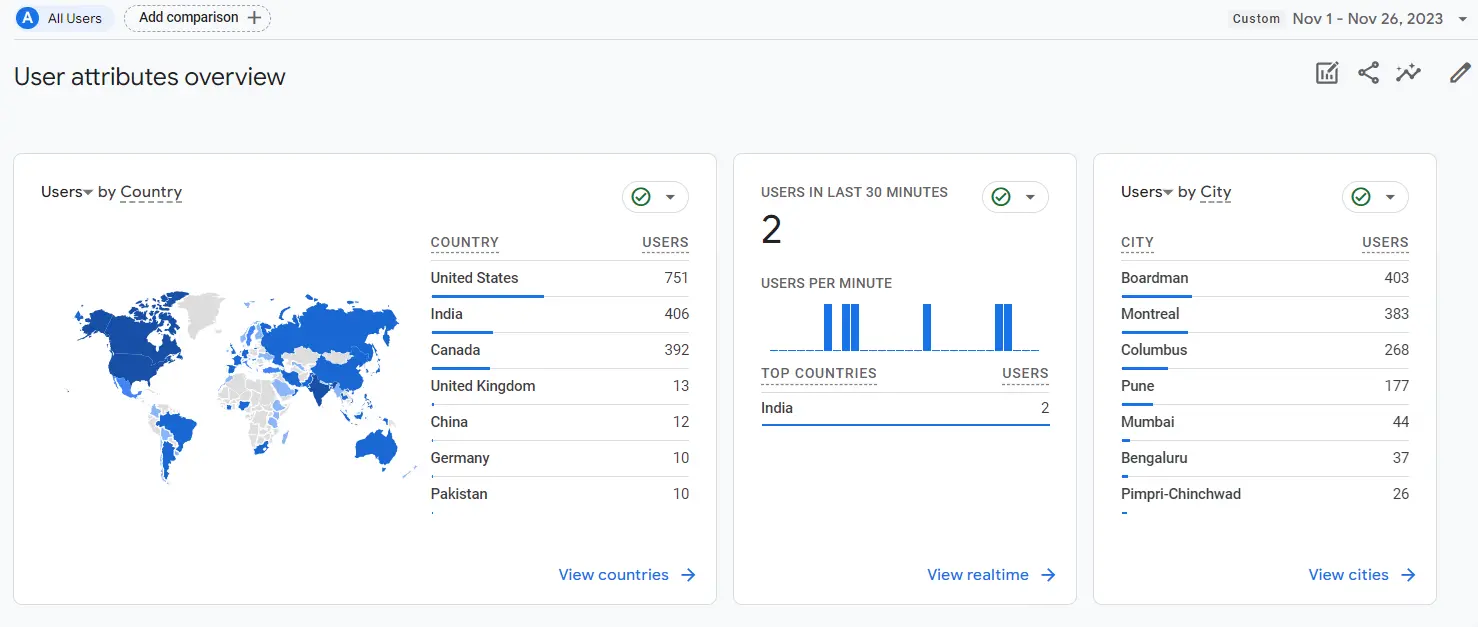
Source: www.analytics.google.com
Google Tag Manager
You need to log in to your Google Tag Manager Account as you did with your Google Analytics account. Login and then you can click on “Verify”
Source: https://tagmanager.google.com/
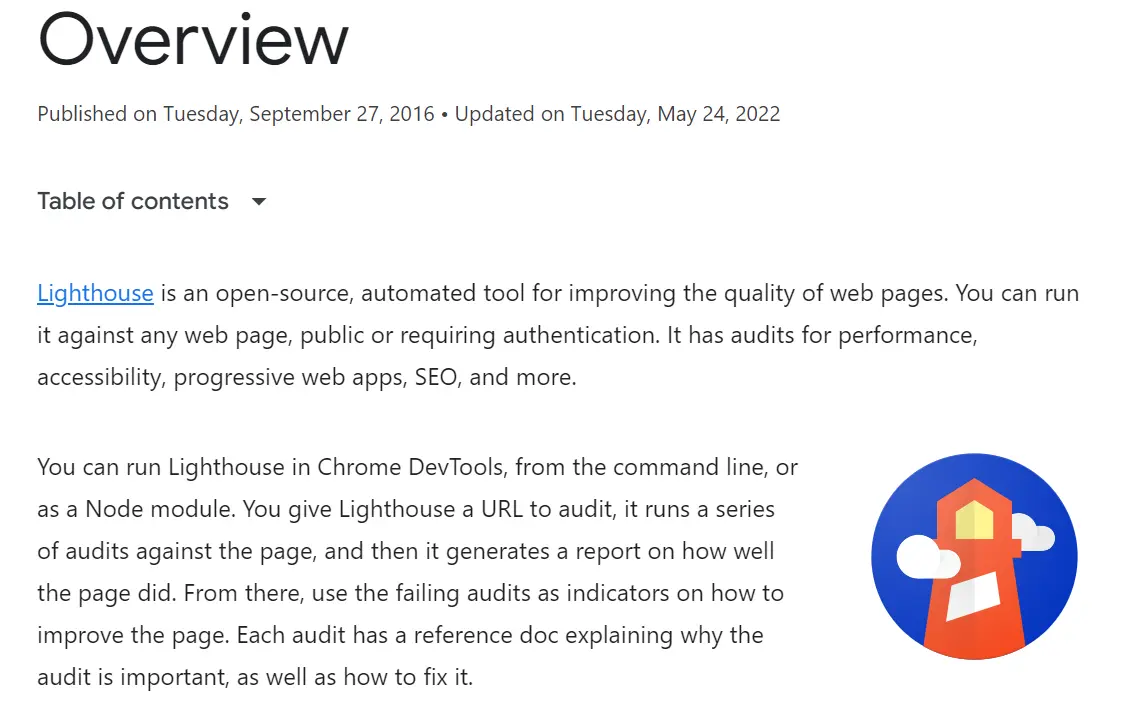
- Lighthouse
Measure your page quality using Lighthouse.
It is an open-source automated tool that improves the quality of web pages. Google’s Lighthouse audits the performance, accessibility, and search engine optimization of web pages. Google’s Lighthouse creates a separate score for different aspects on web pages like:
- SEO
- Rundown of best practices
- Accessibility
- Performance
The performance by Lighthouse is about measuring how fast the browser can assemble a web page. It is a flexible tool and better powered as it provides detailed information about the page’s performance.
You can use Google’s Lighthouse in any of these three ways:
- Use it through Google Chrome DevTools
- Install the Google Chrome Extension
- Run it via Java Node.JS
Lighthouse captures the video of the page loading in the browser. And then it computes how visuals progress between the frames. Then the Speed Index score is determined.
For a good user experience, the sites should have a score of 90-100. Though a score of 100 is very difficult to achieve you can still try for it.
Performance scores and color codes:
| Scores | Colour | Rank |
| 0 to 49 | Red | Poor |
| 50 to 89 | Orange | Need Improvement |
| 90 to 100 | Green | Good |
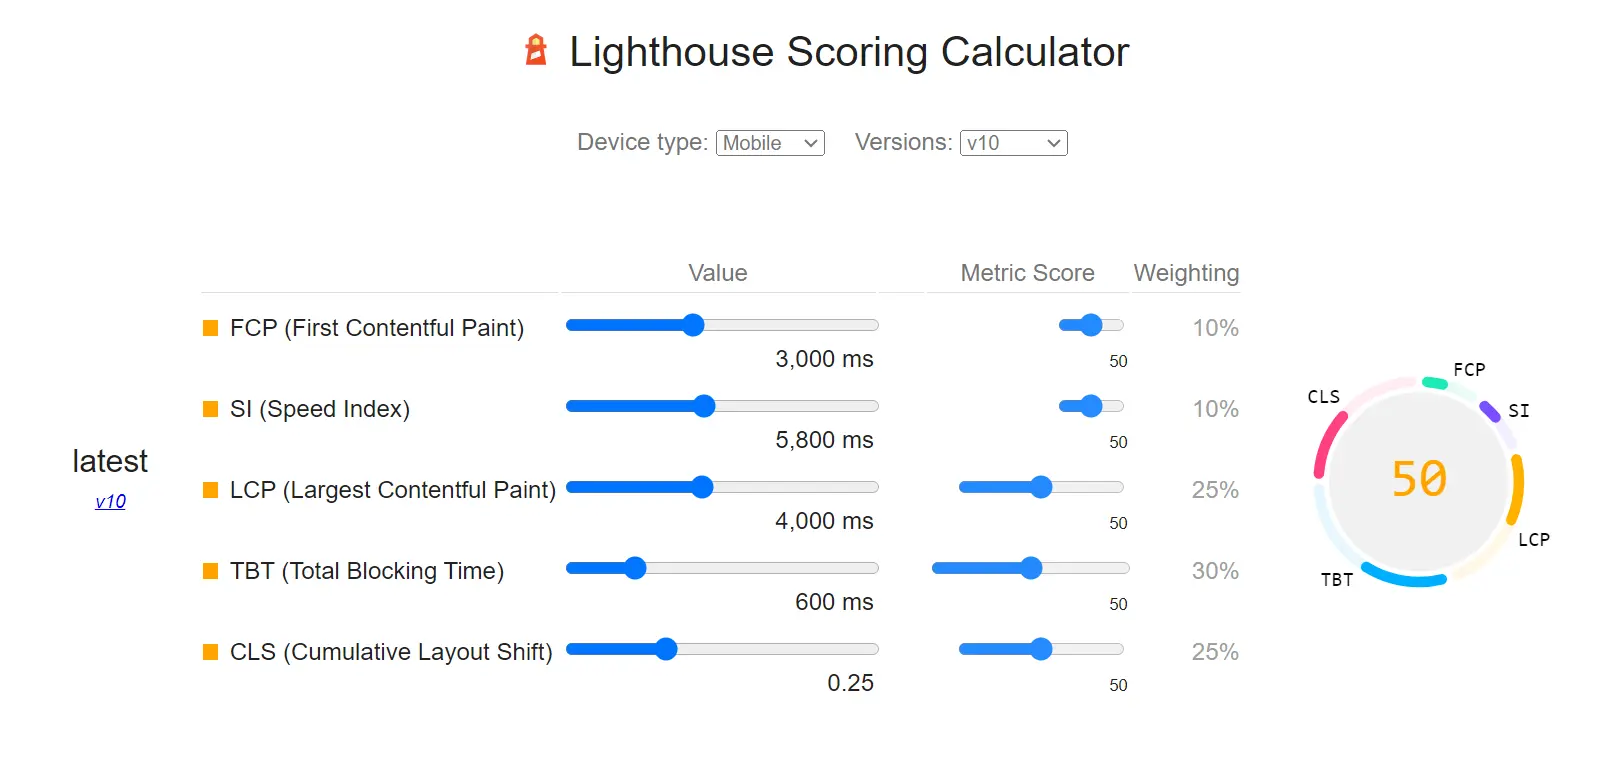
These are the threshold of values that you must attain with the Lighthouse Scoring Calculator.
 There have been various versions of Lighthouse introduced. These are audit metrics and the weight it holds for the performance.
Lighthouse 6
 Lighthouse 8
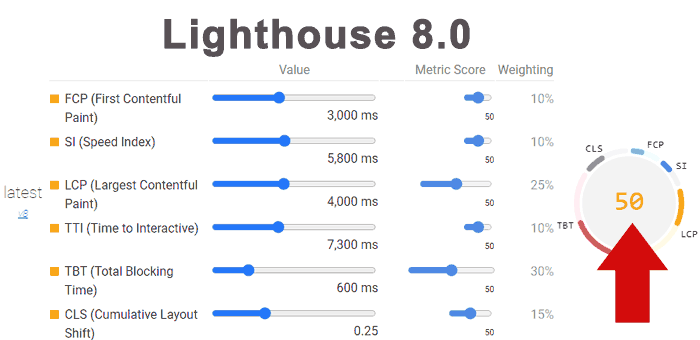
Reasons why use Google’s Lighthouse:
- It is easy to use and it gives accurate audit results.
- The tool is developed by Google-developed and hence is trustworthy.
- The tool is open-source.
- Google’s Lighthouse is fully-automated.
- It tests how scanned web pages perform on mobile devices.
- The tool provides user-centric metrics.
Let us now look at other tools that can measure page performance.
- Chrome DevTools
The Chrome DevTools is a tool packed with features that audit the page’s performance. The tool provides a lot of information on what is reducing the speed of the website and how you can make it faster.
With Chrome DevTools you can find whether the network is the cause of the slow speed. To improve the network performance, the tool will identify whether the server responds to the request quickly or the size of the response needs to be reduced.
- For large responses, that is when the response takes too long to download you will have to minify the JavaScript code. Remove large dependencies and lazy load non-essential code.
- For slow servers, the response checks the back-end code.
In other cases, to improve the speed of the page and resolve network issues, you can clear OS-level the DNS cache or clear the cache via Chrome.
How can you optimize the Core Web Vitals?
Google uses several metrics to verify the website’s performance. The sites that qualify for metrics are most likely to rank higher. It is important to optimize the site so that the search engine is satisfied that the website is not giving the challenge to search engine ranking and overall user experience.
This is why measuring the page speed got important. In common, the Core Web Vitals indicate the page performance, which if good helps the website rank higher in the SERP.
Here are a few ways in which you can optimize the Core Web Vitals:
- Implement a Caching Solution
Caching the content can reduce the effort that the server takes every time it receives a request to load the content. A static HTML version of the page is loaded which saves time for the page to load.
You can check at the server level how you can leverage caching. WordPress users can use a handful of caching plugin tools like W3 Total Cache.
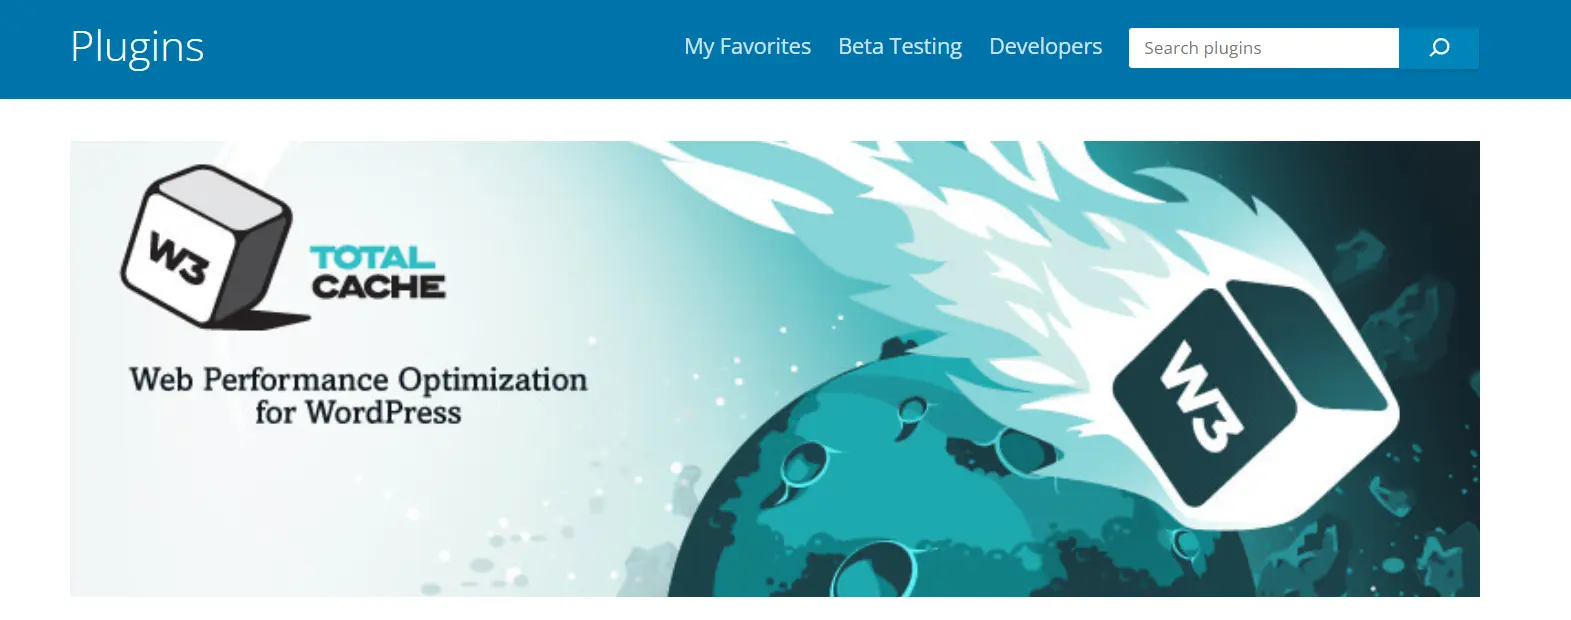
The plugin can help to reduce page speed and boost the site’s performance. It can help in caching CSS and JavaScript, pages and posts, databases, and objects.
- Eliminate Render Blocking Resources
The static HTML, CSS, and JavaScript files required to render a page on your site are referred to as render-blocking elements. The scripts in each of these files have the potential to bar your users from accessing any content. They are typically produced using plugins and tools from external parties, such as Google Analytics.
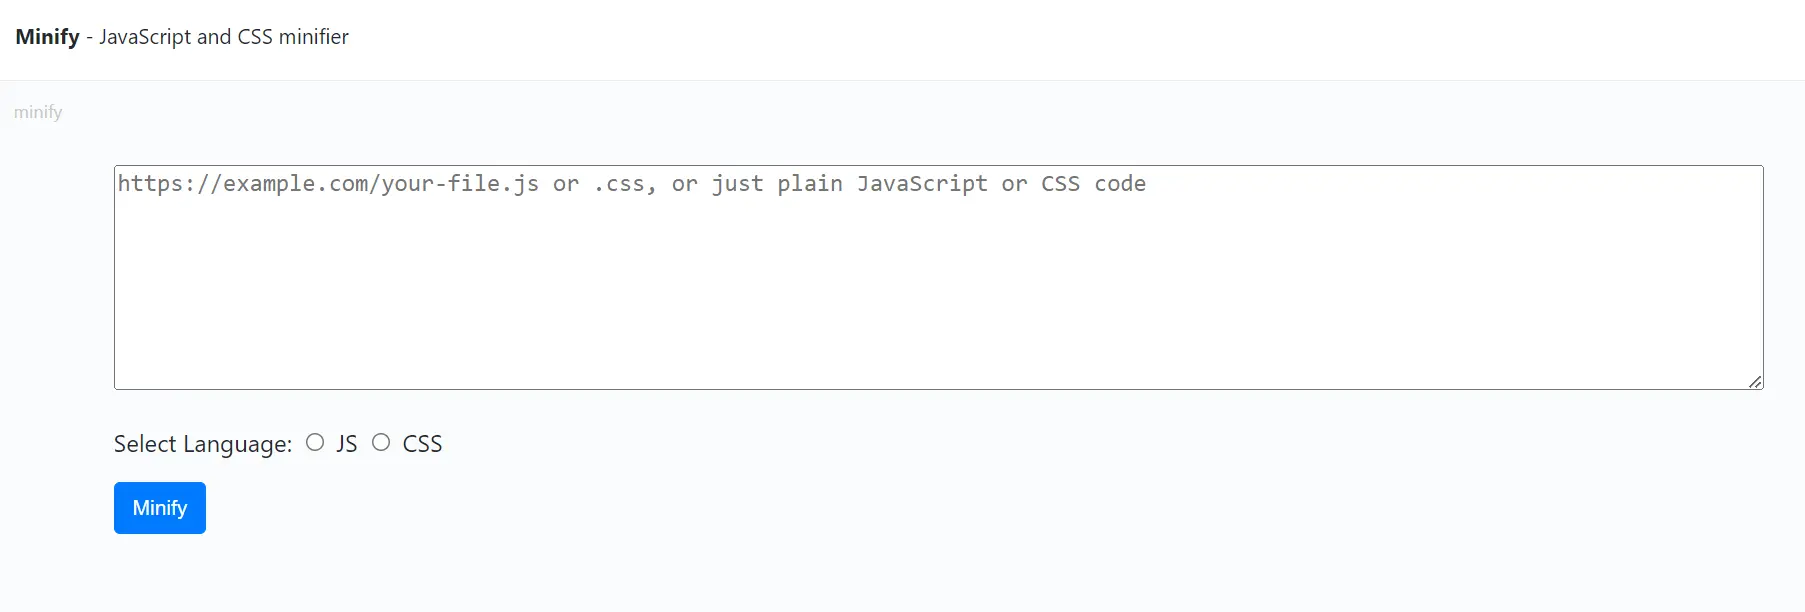
However, removing render-blocking resources and minifying and removing any unneeded CSS or scripts will help you prevent these scripts from degrading your user experience.
You can minify JavaScript and CSS using the CSS minifier tool as it is free to use and the operation is based on a simple copy-and-paste code to replace the old one.
- Defer loading of JavaScript
Defer loading of JavaScript to boost the First Input Delay Scores. In the process, because you delay the loading of JavaScript, it makes the webpage load faster. The content loads faster on the web page once the visitor looks for it.
You can also configure your site settings so that the CSS loads above-the-fold content. It can be done by taking the content out of the CSS file and inlining it in code. After this, the website will load faster and the user experience will improve.
- Use a Content Delivery Network
You can store your material on a network of servers located all over the world known as a content delivery network (CDN). This implies that the content of your website will be served to users from servers that are nearby. This may facilitate even faster loading times.
Users’ LCP times can be sped up by using a CDN. Additionally, it can reduce the Time to First Byte (TTFB).
- Optimize images
Another way to boost the LCP scores is to optimize the images and reduce the file sizes so that the website loads faster. You can use different tools to compress the size of the images:
- TinyPNG
- ShortPixel
- Imagify
- Smush
- EWWW Image Optimizer
When you upload images from Content Management Systems or from the WordPress editor, then it automatically regulates the dimensions of the images.
Using the right attributes on the website for images and videos prevents layout shifts. To check the correct dimension, you can right-click on the image >>Choose “Inspect” >> Check acceptable dimensions of the images for a website.
- Implement Lazy Loading
Use lazy loading. By doing this, you may prevent your photos from loading concurrently with the rest of the web page’s content and guarantee that they will load precisely when viewers reach that area of the page.
Your LCP and loading performance can both be enhanced by using lazy-loading pictures. A lot of WordPress image optimization plugins, like Smush, include lazy loading capabilities.
- Optimize Website Fonts
Website font choices affect how quickly a website loads. This is so that the browser may download and load the whole font family, including all of the different weight variations.
The efficiency of your website can be enhanced by optimizing your web fonts. This is due to the decreased file size and quicker delivery of optimized web fonts.
Additionally, if the web font associated with a text element hasn’t been loaded, a browser might not automatically render that element. However, employing fallback fonts can result in layout changes, which will lower your CLS rating.
- Upgrade WordPress Hosting
The WordPress hosting company you choose is crucial to the performance of your website. Hosting impacts everything, including security and page performance. As a result, you must not ignore performance, particularly if your website is vast or sophisticated.
On the other hand, one of the easiest yet most effective ways to optimize your website and decrease loading times is to upgrade your hosting provider or package.
A managed host can control many technical elements of site performance and has servers tuned specifically for WordPress.
Conclusion
Core Web Vitals are important as they can help your website rank higher. The web vitals measure the page experience score which directly impacts the website’s SEO. If the web vital scores are good, it improves the website’s visibility and increases recognition.
If you have been constantly trying to improve the website’s performance and face the challenge of deploying a skilled team, this is what you can do. Contact us at hello@localhost and our team will connect with you. We can assist you in measuring the website’s performance to taking efforts to improve it.


We would love to have your opinion.